- The Standard Material Data Sheet
- Understanding the Maximum Short-use Temperature
- Yield and Tensile Strength
- Understanding the Relationship between Stress and Temperature
- Understanding the Relationship between Temperature and Aging
- Modulus
- Stress Cracking: The Most Common Cause of Field Failure in Plastic Parts
- Effect of Strain Rate on Modulus and Yield Stress
- Changes in Modulus with Temperature
- Impact Resistance
- Melt Flow Rate
- Other Material Properties
- Don't Make Me Do The Math!
This guide to thermoplastics and injection molding material selection is aimed at an engineer who plans to quantitatively analyze a part, determine loads, stresses, strains, and environments and make an optimal material decision based on the analysis. If life safety is involved, or reliably or efficacy are absolutely required, every part should be engineered and materials selected accordingly. If you look through this paper and see the many factors involved and how environment and application influences material selection, you can understand why an engineer will be very reluctant to recommend a specific material for someone else’s part.
However, many of Brazil Metal Parts’ customers who design parts are not engineers, and many applications of Brazil Metal Parts manufactured parts are quite benign and are expected to stay well within the performance envelope of common plastics. If your application lives at room temperature, it doesn’t have appreciable loads, and you’re willing to make a few parts and whack them with a hammer to see if they’re strong enough for your use, look for the simplified suggestions for selecting materials at the bottom, called “Don’t Make Me Do the Math.”
Material selection can be a guessing game. First, there is a general gap in understanding the fundamental relationship between the internal structure of the material and its properties. Second, accurately defining application requirements is usually given insufficient time and attention. Finally, even when these first two hurdles are overcome it can be hard to find accurate property data for materials.
The Standard Material Data Sheet
The standard material data sheet consists almost entirely of performance characteristics measured at room temperature. In addition, the performance characteristics are associated with catastrophic events that are not considered to be an acceptable outcome for engineered plastic products. Tensile strength at yield and elongation at break represent the standard metrics of material performance, but yield and break are not the desired responses of plastic parts when they are placed under load.
Determining the appropriate material for your application involves synthesizing information from a variety of incomplete sources. The data-sheet is the primary source of information, and you should learn to extract as much information as possible from this source. Appendix A shows a data sheet for 30% glass fiber-reinforced PBT polyester. This is a good example of a reasonably detailed data sheet.
More than 85,000 commercial options for plastic materials are listed in materials databases, and the real number is probably over 90,000. This extensive set of options can be sorted into approximately 45 polymer families or blends, and these 45 families can be further divided into two broad categories: thermosets and thermoplastics. While thermosets were the first commercial polymers, their use has diminished to the point where they constitute only about 15% of all the material processed in a given year. Therefore, this paper focuses on thermoplastics.
More detailed information can sometimes be obtained from design manuals and application notes published by individual material suppliers and can fill in the gaps in the data sheet. Supplemental information is usually more available for higher performance engineering and specialty materials than it is for commodity materials. If you really want to understand a material you need to be prepared to do a little detective work.
Understanding the Maximum Short-Use Temperature
Maximum short-term use temperature is possibly the most important data sheet parameter. Traditionally, this is the deflection temperature under load (DTUL), also called the heat deflection temperature (HDT). Another related parameter is the Vicat softening temperature. Because DTUL measures mechanical deflection and the Vicat point is closer to the actual melting or softening point of the polymer, the Vicat number will typically be higher. For a material such as the glass reinforced PBT of Appendix A, which is a semi-crystalline material, all of these values will be very close to the crystalline melting point of the polymer, 223°C (435°F). Any application that involves even momentary excursions above this temperature will eliminate this polymer from consideration.
The upper-temperature limit for filled or unfilled amorphous polymers can also be found by looking at HDT or DTUL. For example, for unfilled polycarbonate the HDT values range between 130–140°C depending upon the grade. Vicat softening points, where provided, are a few degrees higher. Amorphous polymers do not show a significant crystalline structure when they solidify, therefore they do not have a melting point. However, they do exhibit something called “glass transition.” From a practical standpoint, this is the temperature at which amorphous polymers lose their load-bearing properties.
For polycarbonate this value, when measured by dynamic mechanical methods, is approximately 153°C, just a few degrees above the Vicat softening point and 10–20°C above the DTUL, depending upon the specimen geometry and how the DTUL is measured. Vicat softening temperatures and DTUL values should never be used as long-term performance characteristics. However, they can be used to gauge short-term heat resistance when short-term is defined in minutes. Any application environment that involves excursions to temperatures above these properties will eliminate that particular material from consideration regardless of any other attributes it may possess.
Yield and Tensile Strength
Long-term performance when a material is under constant stress involves a property called “creep resistance;” if the stress is periodic then fatigue resistance becomes the dominant consideration. The relationship between stress, time, and temperature is complicated and frequently the data needed to make good decisions about long-term behavior of a material under load are not available. Here again the data sheet can provide an upper limit. The upper limit for ductile materials is the yield strength of the material and for brittle materials it is the stress at break. Both values define the point at which the material fails catastrophically. Any environment that involves stresses and strains higher than these values eliminates the material from even short-term consideration. Beyond this simple filter, you will next need to look at long-term temperature effects.
| Table 1: Tensile Strength and Modulus of 43% Glass-Filled Nylon 6/6 at Multiple Temperatures | |
|---|---|
| Temperature (oC) | Tensile Strength (psi) |
| -4° | 36,500 |
| 23° | 30,000 |
| 77° | 17,500 |
| 121° | 12,500 |
Understanding the Relationship between Stress and Temperature
Predicting long-term elevated temperature performance requires access to multiple data points. As the temperatures increase or as the desired lifetime of the product increases, the allowable stress level at which the material can be used decreases according to a function that is dependent upon the thermal and mechanical properties of the specific material. Correlations between short-term and long-term performance have shown that the long-term working stress levels for a thermoplastic will typically be between 20–40% of the short-term strength at yield or at break. Unfilled materials tend to fall in the lower end of this range while highly filled compounds tend to fall into the upper end of this range. Safety factors for a given product will reduce these values and if the temperature of the application environment approaches the DTUL values it is possible for the sustainable working stress to be only 3–5% of the value provided on the data sheet. Some data sheets will give tensile strength and modulus values at multiple temperatures. If available, these data can eliminate a lot of guesswork. Table 1 gives an example of tensile strength values provided at multiple temperatures for a glass fiber-reinforced nylon 6/6.
Understanding the Relationship between Temperature and Aging
All polymers have a long-term sensitivity to oxygen and this sensitivity increases at higher temperatures. Degradation associated with aging is captured by a property called the “relative thermal index,” or RTI. This value comes from a test mandated and administered by Underwriters Laboratories. It is currently the best gauge for measuring the long-term effects of aging on the mechanical and electrical properties of polymers. RTI testing begins by measuring key baseline properties such as tensile strength, notched Izod impact resistance, and arc resistance. Test specimens are then aged at multiple temperatures and the baseline properties are monitored until they decline to 50% of the original values. The time required to reach 50% performance is called the “time to failure.” If three or four aging temperatures are used and the logarithm of the time to failure is plotted as a function of reciprocal temperature, the data points can be fitted to a straight line. This line is then extrapolated to a standard time (normally, about eight years) and the temperature predicted to cause failure at the standard time is the relative thermal index. For most thermoplastics the RTI values are lower than DTUL and Vicat softening values. This is the case for the glass-filled PBT in our Appendix A sample data sheet where the DTUL and Vicat values are all above 200°C (392°F) while the RTI values are 140°C (284°F). However, it is possible for soft, flexible materials with good oxidative stability, such as PTFE, to have RTI values that are higher than their DTUL numbers. RTI values can be used to predict long-term performance where aging is the primary concern.
The aging process follows an empirical rule that relates degradation to temperature. The rate of degradation doubles with each 10°C increase in temperature. This is an exponential relationship so a change of 20°C will increase the degradation rate by a factor of 2^2 or 4 while an increase of 30°C increases the rate by a factor of 2^3 or 8. Since RTI is indexed to a time frame of approximately eight years, you can estimate that a material could survive for four years at a temperature 10°C above the RTI, two years at a point 20°C above the RTI, and one year at a point 30°C above the RTI. Safety factors should be built into this calculation since studies show that the actual acceleration factor, while nominally 2, can vary from as low as 1.8 to as high as 2.5.
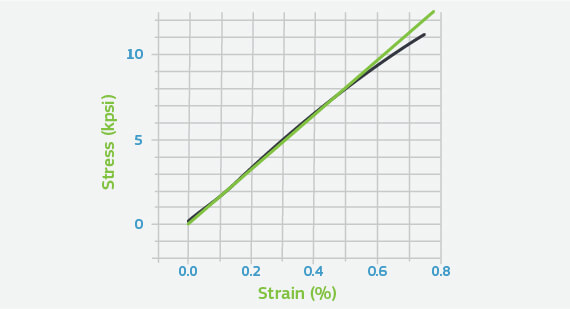
Figure 1: Initial portion of tensile stress-strain curve for 43% glass-fiber reinforced Nylon 6/6.
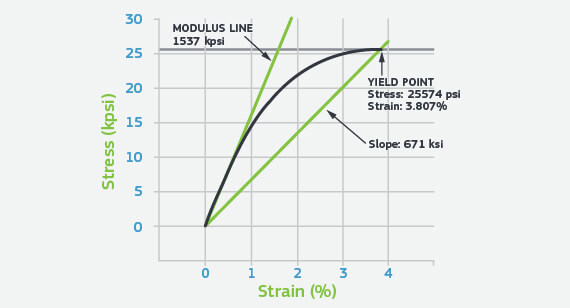
Figure 2: Full stress-strain curve for 43% glass-fiber reinforced Nylon 6/6.
Modulus
Modulus is provided on virtually every data sheet. Most often this is provided as tensile modulus or flexural modulus. The modulus relates stress to strain and can be thought of as a measure of stiffness. In most cases the modulus is calculated in the linear region of the stress-strain curve. Linearity often is lost at very low strains. Figure 1 shows a magnified view of the early portion of a stress-strain curve for a highly-glass-fiber-reinforced nylon 6/6. While the modulus of this material at room temperature is given as 10600 MPa (1,537,000 psi), the graph shows that the stress-strain plot departs from linearity at approximately 0.4%. Beyond this point each incremental increase in stress produces a progressively larger corresponding strain. Figure 2 shows that while the slope of the modulus line reflects the value provided on the data sheet, the effective slope of the line connecting the origin to the yield point has a slope that is only 40% of this reported value. Therefore, when using the modulus as a selection property it is important to understand the position of the application stress on the stress-strain curve. As application stresses approach the yield point the expected lifetime of the product declines. Table 2 shows the maximum operating stress for a polycarbonate material as a function of time at two different temperatures. At very short times, less than an hour, the stress limit is nearly the same as the yield stress for the given temperature. As the time frame of the application increases under load, the maximum allowable working stress declines.
Stress Cracking—The Most Common Cause of Field Failure in Plastic Parts
If a chemical is present in the application environment that is capable of inducing a phenomenon called “stress cracking,” the maximum operating stress declines. Table 3 shows the maximum working stress for the same polycarbonate profiled in Table 2 where the constant stress is coupled with the presence of a fluid that acts as a stress crack agent. It shows that the mechanical capability if the declines compared with the properties when this chemical is absent. Failure of a plastic under the combined influence of stress and a chemical agent is called environmental stress cracking (ESC) and it is the most common cause of field failure in plastic parts.
| Table 2: Maximum Working Stress as a Function of Time for Polycarbonate at Two Temperatures | ||
|---|---|---|
| Time (hours) | Working Stress at 23°C (psi) | Working Stress at 60°C (psi) |
| 0.01 | 9,200 | 7,200 |
| 0.1 | 8,850 | 7,000 |
| 1 | 8,450 | 6,850 |
| 10 | 8,080 | 6,450 |
| 100 | 7,700 | 6,050 |
| 1,000 | 7,425 | 5,800 |
| 10,000 | 7,100 | 5,100 |
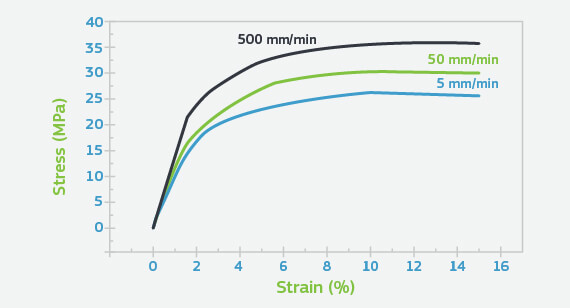
Figure 3: Effect of strain rate on stress-strain properties on polypropylene.
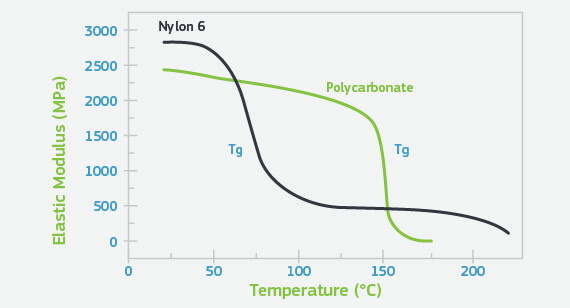
Figure 4: Modulus vs. temperature behavior for an amorphous and semi-crystalline polymer.
Effect of Strain Rate on Modulus and Yield Stress
Some material properties are strain-rate dependent. The rate at which the material is loaded will have an influence on the modulus as well as the yield stress as is shown in Figure 3. Higher strain rates produce greater values for modulus and yield stress. While it is desirable for all suppliers of a given type of material to use the same strain rates when testing, this is not always the case and there can be apparent differences in data sheet properties caused by this lack of harmonization.
Changes in Modulus with Temperature
Modulus changes with temperature. A data sheet that lists modulus values for multiple temperatures such as those shown in Table 1 will create a more complete picture of a material’s behavior. However, it is rare to find data for more than four temperatures and these can span a range of 150–200°C, leaving a great deal of uncertainty about the behavior of the material between these points or outside of the range defined by these points. Dynamic mechanical analysis (DMA) allows for a continuous measurement of modulus over a wide temperature range. Figure 4 shows modulus versus temperature curves for polycarbonate, an amorphous polymer, and nylon 6, a semi-crystalline polymer.
These two materials represent behavior typical of their respective structures. Both possess a glass transition that represents the onset of molecular motion in the amorphous regions of the structure. In the amorphous polycarbonate this results in the complete loss of all useful mechanical properties over a relatively narrow temperature range. However, in the nylon the decline in modulus, while significant, is not catastrophic and about 20% of the room temperature performance remains. This is a measure of the contribution of the crystal structure in the polymer. All amorphous polymers exhibit temperature-dependent behavior that is similar to that of polycarbonate, and all semi-crystalline materials display a property-temperature profile that is similar to that of nylon. The essential differences are in the exact transition temperatures for each polymer.
Impact Resistance
Evaluating impact performance from typical data sheet values is challenging because the industry employs many different methods for testing impact resistance and reporting the results. The most common test method for evaluating impact resistance is the notched Izod test. The test employs a specimen with a sharp notch machined into the part and a swinging pendulum is used to impart the energy needed to produce failure.
The minimal radius in the Izod notch often exaggerates differences in ductility because of differences in notch sensitivity among materials. For example, polycarbonate and amorphous PET polyester both possess good practical toughness. PET polyester is more notch-sensitive that polycarbonate. Consequently, the notched Izod impact values for polycarbonate at room temperature may be much higher than those for some grades of PET polyester, giving the impression that polycarbonate is a much tougher material. A more complete picture of impact performance can be obtained if impact results can be obtained from different types of impact tests.
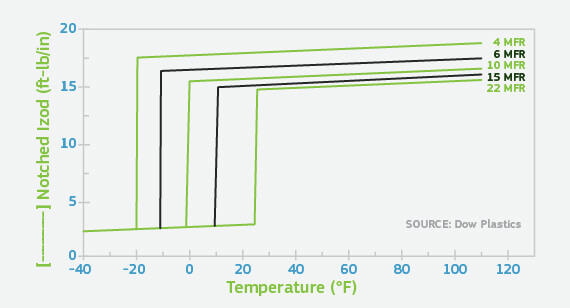
Figure 5: Effect of molecular weight on the DBTT for general purpose polycarbonate.
Falling dart tests such as the Gardner test or the instrumented falling dart impact test can provide additional data points. These tests use specimens where no stress concentration is machined into the part and give a more accurate reflection of the performance that can be expected from a well-designed part.
Impact properties are also influenced by temperature. Lower temperatures are more likely to produce brittle behavior in a material and the transition from ductile to brittle performance can be very sudden. It can be difficult to find a complete picture of this type of behavior because material suppliers are reluctant to report on unfavorable performance characteristics. However, a search can yield valuable results even if these results are not available for all materials. Figure 5 shows the notched Izod impact behavior for different grades of polycarbonate as a function of temperature. These results illustrate the Shunjing change from ductile to brittle behavior that typically occurs as a function of declining temperature. This graph also shows that the transition from ductile to brittle performance is related to the molecular weight of the polymer. The lower melt flow rate values are associated with grades having higher average molecular weights. This property has a significant influence on the temperature at which the impact performance changes.
Melt Flow Rate
Melt flow rate is a property that appears on most property data sheets. It is an attempt to capture an important aspect of material behavior with a single number. Melt flow rate is often used by processors as a gauge of how a material will flow during molding. The significance of the melt flow rate value is its relationship to the average molecular weight of the polymer. Lower melt flow rate values are associated with materials of higher average molecular weight. Higher molecular weight, in turn, provides for improved properties, especially in the areas of impact resistance, creep and fatigue performance, and barrier properties.
Comparisons of materials based on melt flow rate are only valid if they are made within a particular polymer family. In addition, some materials employ multiple conditions for testing. For example, ABS can be tested in different conditions defined by the temperature and the load that is placed on the material. These test conditions are shown in Table 4 along with the typical differences in the results associated with each condition. When comparing two grades of materials it is important to note the test parameters and adjust accordingly.
| Table 4: Effect of Test Conditions on the Melt Flow Rate of ABS | |
|---|---|
| Test Conditions | Nominal Melt Flow Rate (grams / 10 mins.) |
| 200°C / 5.0kg |
1.5 |
| 230°C / 3.8kg | 4.5 |
| 220°C / 10.0kg | 18.0 |
| Table 5: Coefficient of Expansion Values for a 43% Glass-Filled Nylon 6/6 Over Different Temperature Ranges | ||
|---|---|---|
| Test Conditions (oF) | Nominal Melt Flow Rate (grams / 10 mins.) | |
| -40° to 73° | 0.000034 | |
| 73° to 131° | 0.000044 | |
| 131° to 320° | 0.000071 | |
Other Material Properties
Properties other than thermal and mechanical can be important in specific applications. These include electrical properties such as dielectric constant and strength, surface and volume resistivity, and coefficient of thermal expansion. Standard measurements of the coefficient of thermal expansion are made between -30°C and +30°C. However, some suppliers will provide values across multiple temperature ranges such as those represented in Table 5. When this more complete picture is available it shows that these types of properties are also dependent upon temperature and the values tend to increase with increasing temperature.
Plastics are generally considered to be excellent electrical insulators unless a compound is made specifically to dissipate static or be somewhat conductive through the addition of ingredients such as carbon or stainless steel. Therefore, values for resistivity are very high for most materials, between 10^10 and 10^16 ohms or ohm-cm for surface and volume resistivity, respectively. Sustained electrical stress can result in the dielectric breakdown of a material over time. This behavior will depend upon the magnitude of the voltage being applied and is captured most effectively by properties that may be part of the standard data sheet but may be more readily found in the Underwriters Laboratories database as part of their Yellow Card system. This method applies numerical values to properties such as high amperage ignition, arc track resistance, and continuous tracking index with the lowest values for each metric indicating superior performance and higher values associated with lower levels of performance.
Don’t Make Me Do The Math!
A consultant usually won’t make a material recommendation without understanding the complete application requirements for the part, and without running a design analysis on the 3D model of the part. Sometimes, it’s not cost-effective to fully engineer the part to come up with a material selection. If you want to short-circuit the materials engineering and take an educated chance on material selection, here are a few rules of thumb you can use:
- Try ABS. ABS works for many, many applications. It’s reasonably priced, strong, relatively tough, has a decent appearance and is forgiving even if you don’t follow all the standard design rules for plastic parts. It does have a relatively low melting point. All the parts in our demo mold are ABS.
- If it needs to be cheap and rigidity and cosmetics aren’t really important, try polypropylene (PP). Our design cube is made of PP.
- If you need something a little tougher than ABS or able to withstand a little higher temperature, try polycarbonate (PC). PC is less forgiving than ABS if you don’t follow the standard design rules for plastic parts.
- If it needs to be nice-looking and transparent, try acrylic (PMMA). PMMA can be a little brittle. A transparent PC will be tougher than PMMA but a little less cosmetically nice.
- If rules 1–4 don’t point you where you need to go, then you need to start doing the math.
If you’re going to mold parts, you might try having a couple test parts in the target material made by our CNC machining service before committing to a mold. Molds are designed to match the shrink rate of a particular resin, so it may not be possible to run multiple resins in the same mold without risk to part size, tolerances, and/or dimensions.